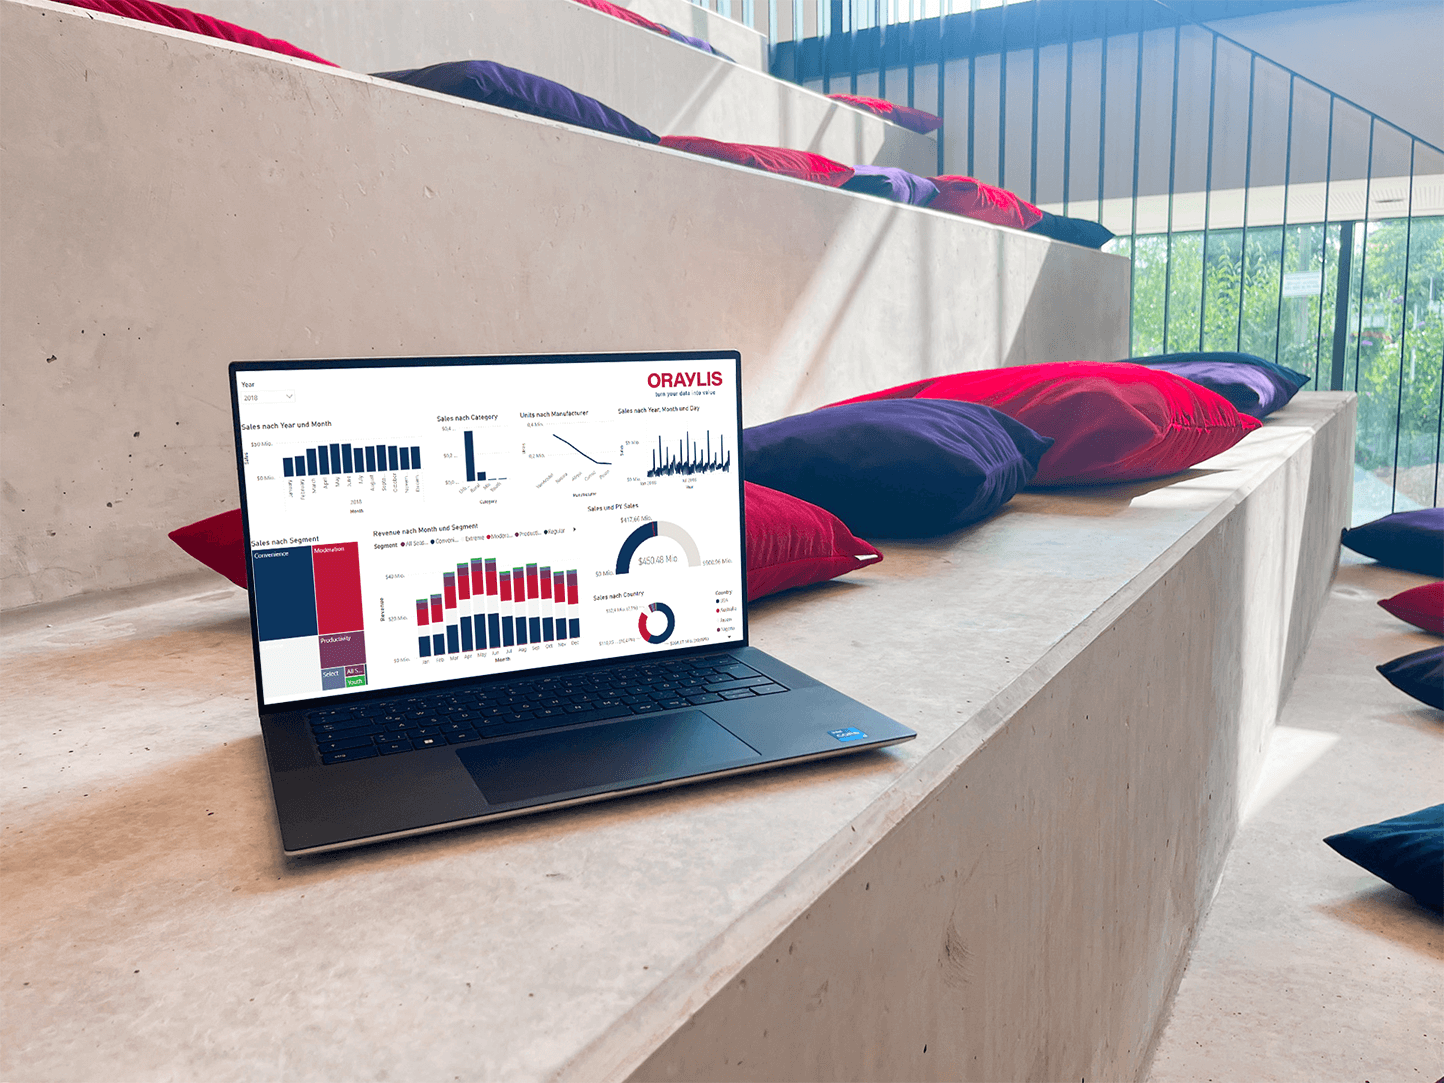
Let your data make the decisions
Everyone is talking about data when it comes to digitization. But first and foremost, it’s about extracting relevant information from your growing volumes of data. Professional data visualizations are the key to this. They ensure that even complex facts are easy to understand. So you can quickly grasp the essentials and turn them into successful decisions.

YOUR VISUALIZATION MANUAL
Quick Insights through Information Design
Information design establishes more and more in company-wide reporting. With clear requirements for the structure and design of data visualizations it enables the consumer to understand all the information quick and easy. The set of rules must be developed for every company individually. Finally you have an Information Design Style Guide which supports an efficiant communication without misunderstandings. You not only ensure a better flow of information within the company and beyond. Rather, you discuss current issues on the basis of reliable data and facts. That means: You make better decisions and derive better measures.
Your benefits
How you profit from data visualizations
Better data understanding
Consistant visualization rules and a focus on the essentials brings you a better understanding of your data and more valuable business knowledge.
Spread information faster
With condensed information you ensure that report consumers can quickly grasp the importants facts even if they are more complex.
Make processes transparent
Integerate Process Mining to visualize entire processes fast and efficiently with real process data and derive measures for improvement.
Systems are always up-to-date
Reliable results and high performance lead to positive user experiences and constant usage, which keeps the system up-to-date and supports further development.
Focus more on business
A seamless integration of analytical tools into your office environment allows you to connect data and business requirements ideally.
Make better decisions
Decision-makers are discussing current issues on the basis of reliable data and facts. The results are better decisions and better measures.
Your technologies
The right tools for your solution
When developing your customized analytics platform, we rely on the highly scalable services of the Microsoft Azure Cloud. This gives you an optimal result that can grow flexibly with your requirements of tomorrow. The starting point here is Power BI, which seamlessly integrates into Office 365 and thus combines data and business requirements optimally. You can also integrate Process Mining and get an up-to-date picture of what is happening in your company’s processes. Finally, selected processes can be automated with the Power Platform via Robotic Process Automation (RPA).

turn your data into value
Let’s get started!
Together with my team, I develop customized solutions for data visualization. How can my expert knowledge help in your projects? Let’s have a talk.


